"Figure
4.
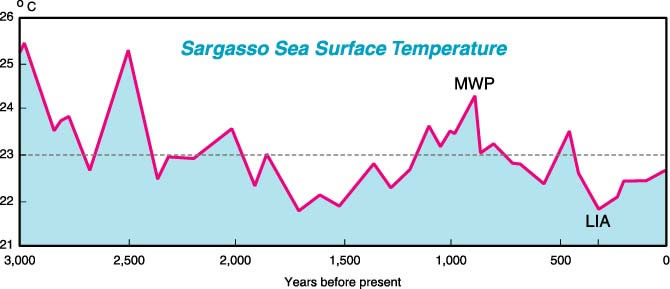
This graph shows the Sargasso Sea surface temperature,
which was derived from oxygen isotope ratios. This is an
indicator of evaporation and, therefore, a proxy for sea-surface
temperature. The Sargasso Sea is a two-million-mi2 body
of water in the North Atlantic Ocean that lies roughly between
the West Indies and the Azores from approximately 20-35oN.
It is relatively static through its vertical column so that
potential interference from mixing with other water masses
and sediment sources is minimal. The isotopic ratios are
derived from biotic debris that has precipitated onto the
sea floor. Wide and abrupt variations in temperature are
indicated. The relative temperature variations of the Little
Ice Age (LIA) and the Medieval Warm Period (MWP)
are prominently recorded in the data. Note that the temperature
has been increasing since about 300 years before present
(1700 A.D.) The horizontal line is the average temperature
for this 3000-year period.
After Keigwin, L. D., 1996,  The
Little Ice Age and Medieval Warm Period in the Sargasso
Sea: Science, v. 274, p. 1504-1508. -
[date of access: 05.03.08] The
Little Ice Age and Medieval Warm Period in the Sargasso
Sea: Science, v. 274, p. 1504-1508. -
[date of access: 05.03.08]
The
entirety of Holocene climatic history can be characterized
as a sequence of 10 or more global-scale "little ice
ages," fairly irregularly spaced, each lasting a few
centuries, and separated by global warming events.
Direct
instrumental measurements
Direct
instrumental measurements indicate that the average temperature
at the Earth's surface increased about 0.8oC from 1866 until
1998 (Figure 2). During this same time, the concentration
of CO2 in the atmosphere increased from 280 to 353 parts per
million volume. Because this period of time very nearly coincides
with the industrial revolution, the supposition arose that
the warming was caused by human activities. Most of the warming,
however, took place before most of the CO2 increase occurred.
Statistical analyses of the climate record since 1860 show
that significant interannual and interdecadal variability
occurred. This suggests that the warming had causes other
than an increase in greenhouse gases alone. The increase in
temperatures recorded by direct measurements may be part of
a longer-term warming trend that began after the Little Ice
Age and before the Industrial Epoch. Many poorly understood
factors influence atmospheric CO2 concentrations. For example,
because the current increase follows a 300-year warming trend,
the observed increases in CO2 are of a magnitude that can
be explained by oceans giving off gases naturally as temperatures
rise.
Conclusions
A
review of research on past temperatures and variations led
us to the following conclusions:
- Climate
is in continual flux: the average annual temperature is
usually either rising or falling and the temperature is
never static for a long period of time.
-
Observed climatic changes occurred over widespread areas,
probably on the global scale.
- Climate
changes must be judged against the natural climatic variability
that occurs on a comparable time scale. The Little Ice Age,
Medieval Warm Period, and similar events are part of this
natural variability. These events correspond to global changes
of 1-2oC.
- Global
temperatures appear to be rising, irrespective of any human
influence, as Earth continues to emerge from the Little
Ice Age. If the temperature increase during the past 130
years reflects recovery from the Little Ice Age, it is not
unreasonable to expect the temperature to rise another 2
to 2.5 degrees Celsius to a level comparable with that of
the Medieval Warm Period about 800 years ago. The Holocene
Epoch, as a whole, has been a remarkably stable period with
few extremes of either rising or falling temperatures, as
were common during Pleistocene glacial and interglacial
periods. Nevertheless, the Holocene has been, and still
is, a time of fluctuating climate.
- Climatic
changes measured during the last 100 years are not unique
or even unusual when compared with the frequency, rate,
and magnitude of changes that have taken place since the
beginning of the Holocene Epoch. Recent fluctuations in
temperature, both upward and downward, are well within the
limits observed in nature prior to human influence.
Editors
note:
This article was summarized from "Rate
and Magnitude of Past Global Climate Changes,"
which was published in Environmental
Geosciences, volume 6, number 2, 1999, pages 63-75. The authors
are John P. Bluemle (State Geologist of North Dakota, Bismarck,
ND), Joseph M. Sabel (geologist with the U.S. Coast Guard
in Oakland, CA), and Wibjörn Karlén (Professor
of Physical Geography at the University of Stockholm, Sweden).
In the Environmental Geosciences article the authors include
citations to more than 70 peer-reviewed reports."
Adapted
from: Bluemle,
John P. (1999) Global Warming: A Geological Perspective.-
Arizona Geology. Vol. 29. No. 4. http://www.azgs.az.gov/vol29no4.htm,
Last review on February 14, 2007.
[date of access: 17.05.07]
|